
|
|||
|---|---|---|---|
|
|
Physical fitness: tripartite comparison of 6-14 year old children from Uganda, Cuba and Mexico Eficiencia física: comparación tripartita entre niños de 6 a 14 años de Uganda, Cuba y México |
|
|
|
*Lecturer, Kyambogo University Kampala (Uganda) **Consultant, University of Physical Culture and sports science. Havana (Cuba) |
Dr. Roland Shimey Mukana* Dr. Hermenegildo Pila Hernandez** |
|
|
|
Abstract This article focuses on comparing the physical fitness levels of children aged between 6 and 14 years from Uganda, Mexico and Cuba. The comparison is done using the 90th percentile obtained from studies performed in the three countries. Results show that 77% of the comparisons in the speed tests favored Uganda in both sexes while 100% of the comparisons in the strength endurance test of the arms favored Cuba, similarly 61.1% of the abdominal test comparisons favored Cuba. 100% of the leg power test favored Uganda just like the endurance test where 75% of the comparisons favored Uganda. In general, most comparisons favored Uganda with Cuba closely following and Mexico in third place in the various physical capacities. Keywords: Physical fitness. Comparison. Physical capacity.
Resumen Este articulo trata acerca de comparaciones de niveles de eficiencia física de los niños de 6-14 años de Uganda, México y Cuba. Estas comparaciones se hicieron utilizando el percentil 90 obtenido de las normas de eficiencia física que surgieron de los estudios hechos en cada uno los tres países. Los resultados muestran que el 77% de las comparaciones favorecieron a los niños ugandeses en la capacidad rapidez en ambos sexos mientras que el 100% de las comparaciones en la resistencia de las extremidades superiores favorecieron a Cuba igual que en el test de abdominales, 61.1% de las comparaciones estaban a favor de Cuba. En el test de la fuerza explosiva de las piernas, el 100% de las comparaciones favoreció a Uganda al igual que en el test de la resistencia aeróbica el 75% de las comparaciones fueron a favor de Uganda. En general, la mayoría de las comparaciones fueron a favor de los ugandeses, en segundo lugar, los cubanos y en tercer lugar, a los mexicanos, en las distintas capacidades físicas. Palabras clave: Eficiencia física. Comparación. Capacidad física.
Reception: 04/13/2016 - Acceptance: 09/20/2016
1st Review: 09/02/2016 - 2nd Review: 09/17/2016
|
|||
|
|
Lecturas: Educación Física y Deportes (EFDeportes.com), Revista Digital. Buenos Aires, Año 21, Nº 220, Septiembre de 2016. http://www.efdeportes.com/ |
|
|
1 / 1
Introduction
Brief history of sports and physical fitness tests
The practice of sports activities is traced way back to the very first existence of man, in the most ancient towns; there is evidence of “sports deeds” i.e. Actions that man has been performing since prehistory: running to escape from animals, jumping to skip natural obstacles, swimming across big water bodies, throwing arms like spears or fighting body to body with his enemies. These deeds were ritualised in ancient societies and remained associated to religion or celebrations. Examples like precolombus civilizations that practiced a certain game with a ball (tlachtli), Egyptians that practiced Bow and Arrow shootings, and “the nautical righteous” in Greece, powerful men were measured by car racing and wrestling almost half a millennium before the first ancient Olympic Games could be celebrated, these were the first champions in sports.
In Olympia, towards the year, 776 B.C, the first ancient Olympic Games were convened that used to last for six days and consisted of fighting and athletic races. In the 4th century upon the fall of the Greek civilization, these games also collapsed.
Competitive sport remained silent till the 19th century, where there emerged a very strong link between sports and war with the Bow and Arrow shooting boom and Fencing tournaments becoming popular just like the ball games in France and Golf in Scotland. The renaissance of competitive sports activities materialized in Great Britain and the Northern European countries thanks to the Industrial Revolution in the 19th century which facilitated the establishment of the Oxford- Cambridge Regatta in 1829 as well the invention of Rugby by the British Rugby School students.
With time, the principal sports value evolved, it was no longer a matter of just competing against an opponent but also challenging the time in which victory was to be achieved. This was possible thanks to the scientific advancement that made it possible to measure space and time more accurately. Simultaneously, more sports like Football, Water Polo, and Table Tennis continued to emerge during the 20th century.
In 1892, the Baron, Pierre de Coubertin promoted the idea of re-establishing the Olympic Games which materialized two years later during the course of a congress that also witnessed the founding of the International Olympic Committee (IOC). In 1896, in Athens, Greece, the first edition of the Modern Olympic Games was celebrated. Although only 13 countries, 295 athletes participated, the games marked the beginning of a new era of competitive sports. And to this date, they are celebrated every four years.
Olympism became a universal culture and a unifying platform in which all countries prepare the best teams to take part in various sports modalities every four years in pursuit for the highest number of medals. This has increased the need for carrying out research aimed at improving the quality and performance of various countries in the different sports.
Furthermore, many scientists have carried out studies aimed at selecting the best and most prepared athletes in terms of skills and aptitude to represent their countries in international competitions such as Olympic games, World and Regional Championships and Tournaments etc, one of the most outstand elements in all these studies is Physical Fitness and physical fitness testing.
Pila (1989) cites Larson and Yocon (1951), who notes that “Physical Fitness, as a means of evaluating the anatomic performance emerged at the beginning of the 20th century as a result of the need to evaluate the external performance of the body along with the functional and anthropometric measurements and this marked the creation of the first Tests that were invented by the Americans, D.A. Sargent y E.G. Martin.”
With time, physical fitness tests started gaining more importance mainly in military preparation of the different sectors such as Air Force, Naval Aviation, Marine etc of the United States Defense Forces. Later on these tests were employed in the Physical Education Office of the United States of America which marked their introduction into the area of sports as was the case with some European countries and Cuba by 1911.
Since then more people have appreciated the importance of physical fitness testing as a way of ensuring high performance in sports and as a result, different countries have designed special fitness tests to be administered on to their populations.
Many authors express the importance of physical fitness tests and try tirelessly to reduce the nonphysical activity lifestyle en their respective populations. This relates to Soto (2000) as quoted by Fuentes (2003): “Various authors have differentiated the components of physical condition directed to high performance from that which intends to improve or maintain good health. In line with this, we are of the view that the capacities that must be the principal target for development at these ages are besides velocity, and the psycho-motor capacities, the components of a healthy physical condition that are associated to a low risk of prematurely developing diseases derived from living a nonphysical activity lifestyle (Cantera, 1997). Such components, according to different authors are the following: cardiovascular endurance, movement amplitude, muscular endurance and power. (Pate, 1988 y 1995; Carpersen y col., 1985; Pate y Shephard, 1989; Simons-Morton y col., 1990; American College of Sport Medicine, 1991 y 1998)”
Up to this moment, it can be noticed that physical fitness tests have gone beyond the military purposes for which they were designed and in the same way, they have surpassed the sports aims because presently they are employed within the medical field, an aspect with which Pila, H (1989) agrees when he says “it is in my consideration that Fitness Tests as a means of assessment, must be seen from even a wider angle, must be seen generally as promoters of physical health of the people since they not only measure physical fitness or body performance but also provide information concerning the health of the population”. This is in line with what former Cuban leader, Fidel Castro planted as quoted by Pila y Alonso (1985): “Be completely contented that we have saved a lot of money previously spent on public health by investing it sports y Physical Education since we win it back in the wellbeing and prolongation of the lives of our citizens”.
Pila (1989) refers to De Armas (1978) when he quotes Ozerecky (1923) and Johnson (1932) who assert that after the Second World War, it was proved that the American youth possessed lower physical fitness levels as compared to their counterparts in Europe which led to creation of special Tests namely: Indiana Physical Test, Franklin a Lettstena, youth physical test among others, pointing 1958 y 1965 as the years of great achievement. This was the first time fitness levels were being compared between different populations, a moment that further expressed the importance of carrying out physical fitness testing since it can be used to make comparisons across countries and have an idea of their physical activity patterns, health index, and life expectancy among other indicators. Not many studies compare the physical fitness level between different countries due to the fact that not all countries apply the same physical fitness tests to their populations hence making it difficult to do such comparisons.
In this article we analyze and compare the fitness levels between three countries, this is possible because the same methodology was used to apply the tests in all the three countries.
Why is physical fitness a key to success in sports?
Physical fitness is one of the most determinant factors of success for any sports team and one of the main reasons as to why teams will lose important games. For example in football, it is quite common in most of the games world over that most goals are scored in the last quarter of the game, hence this is direct implication that teams will concede unnecessary goals mostly because they are unable to match up to their rivals’ fitness hence subjected to making avoidable mistakes or simply due to the fact that they are too tired to compete for the ball and apply the necessary technical skills for an effective tactical execution.
It is also important to note that an athlete’s life is characterized by competitive football all year round hence he is required to maintain an average form all year round with peaks seasonally as is the case with other sports. This characterization has made it difficult to ignore the importance of maintaining the players on some kind of form all the time to ensure that the team always performs excellently. This means that the training methods applied by the coaches should keep the player averagely on form all year round with peaks that give them the best performance periodically.
Furthermore, a physically fit athlete is more likely to assimilate the technical skills and execute the tactical processions more effectively than one with bad physical condition. This further necessitates emphasis on physical fitness training.
In this article, we do a comparison of the 90th percentile obtained from the fitness level norms of Cuba, Mexico and Uganda. The 90th percentile is a score which can only be obtained by 10% of the participants in each case.
The objective of this article is to compare the fitness levels of the 6-14 year old children from Mexico, Cuba and Uganda using the 90th percentile.
Materials and methods
The following tests were applied to the children:
-
Speed (30m sprint for 6-11 years and 50 m sprint for 12-14 years).
-
Strength endurance of the arms (pushups).
-
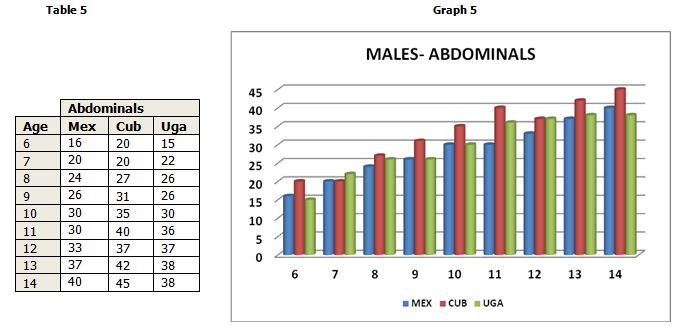
Strength endurance of the abdominal muscles (abdominals).
-
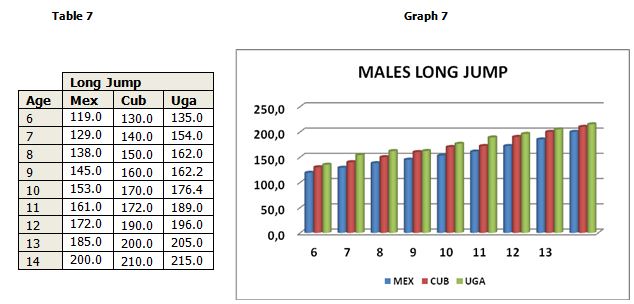
Explosive strength of the legs (long jump).
-
Endurance (600 m).
The detailed methodology of the procedure used during the actual testing is published in the book: Pila, H. and Hernández, G. (2000), Métodos y normas para evaluar la preparación física y seleccionar Talentos Deportivos. Mexico City.
This comparison is done based on studies performed in the three countries, systematic and stratified random sampling techniques were used and in Mexico, the total sample was 160,263 participants from all the states of Mexico, while in Cuba a total of 36,773 participants took part in the study and in Uganda a total of 2706 participants from Busowa community, Bugiri district were assessed. Studies in both Cuba and Mexico were carried out by Dr. Pila Hermenegildo.
SPSS (Version 12) was used to analyze the data and the Percentile analysis method was used to create norms for assessing fitness levels in all the three countries. This method divides the data into 10 equal portions (percentiles). For this particular article, the comparisons are done using the 90th percentile which the result is obtained by only 10% of the participants in all the three countries in each test.
Results and discussions
Table 1 and graph 1 shows how the 90th percentile was scored across the three countries among the male participants, the results show that the lowest times were run by Ugandan children while Cuba closely followed as the Mexican children registered the slowest times. This is evident in the ages 6-11 years. This physical capacity was measured using the 30 meter sprint test in these ages while a 50m sprint was used for the 12-14 year olds. As for this age groups, the fastest times were registered by the Cuban 12-13 year olds followed by Ugandans while Mexico came in 3rd place. As for the 14 year olds, the Ugandans gained a slight advantage of over the Cubans who also had a slight advantage over the Mexicans. In most of the ages, the Ugandan males had slight advantage over their counterparts from Cuba and Mexico.
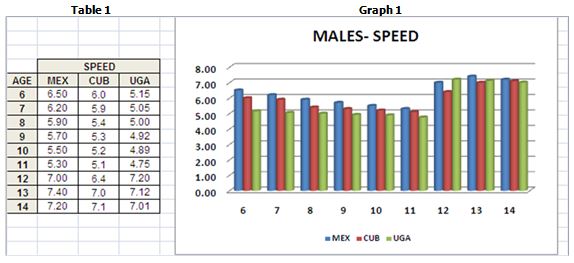
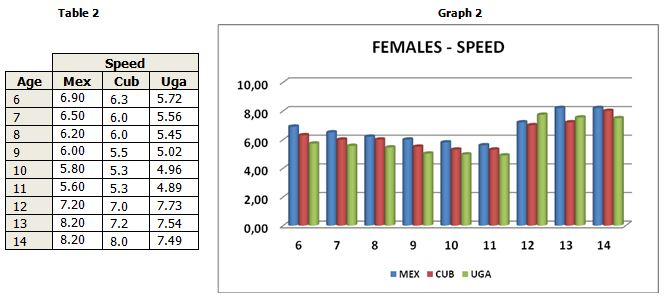
As table 2 and graph 2 show, the female students had similar results, the Ugandan girls registered better times followed by the Cubans and lastly the Mexicans most especially from 6 -11 years as well as the 14 year olds. As is the case with the males, the 12-13 year old Cuban girls registered lower times than the other two countries. The 12 year old Mexican girls registered better times than the Ugandan ones with a difference of about of 50 microseconds. This is the only age where the Mexicans performed better than the Ugandan counterparts in both sexes. Just like in the opposite sex, most of the ages were in favor of the Ugandans.
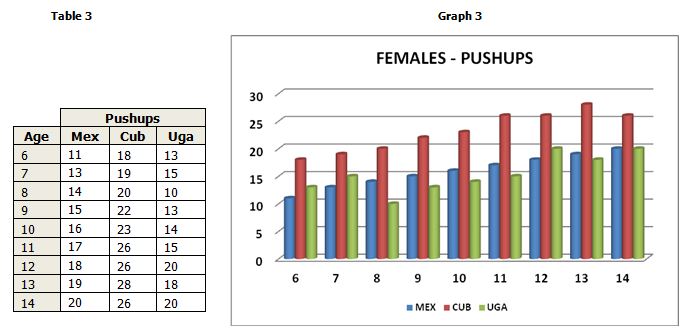
Strength endurance of the arms
This physical capacity was measured by the Pushup test.
Table 3 graph 3 shows the figures reflecting the 90th percentile of the females students as regards the strength endurance of the arms. As the graph shows, in all the ages the level of development of this physical capacity is far more superior in Cuba than in any of the other two countries. The other countries on average have similar results e.g. Uganda performs better in the 6, 7 and 12 year olds while Mexico comes second in the rest of the ages. These results show that Cuba is likely to perform better than the other two countries in sports where this physical capacity is determinant which is in fact the reality in most international competitions most especially in events which require a lot of strength endurance of the arms.
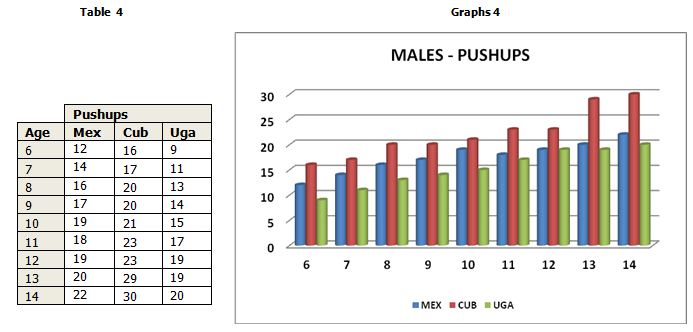
As is the case with the females, the Cuban males are by far more advantaged when it comes to the strength endurance of the arms. In all the ages the Cubans were able to do more pushup s than other two countries. It is important to note that in all the ages, the Mexican performed better than the Ugandan males. This reveals that the Ugandan students have very low strength endurance levels in comparison with other countries which call upon an immediate intervention in the physical education curriculum to focus on the development of this important physical capacity. It is important to emulate the example of the other two countries and develop this physical capacity as it is important in most of the sports. The results also show that whereas Mexico performed better than Uganda, there is still a lot of room for improvement given the results obtained by the Cuban students. Mexico too needs to review the physical education curriculum to stimulate the development of strength endurance in schools
As table 5, graph 5 show, the 90th percentile of the strength endurance of the abdominal muscles, the Cubans males showed better development of this physical capacity in almost all the ages with the exception of the 12 year olds who scored the same percentile as the Ugandans and the 7 year olds where the Ugandans had the best scores as compared to their Latin counterparts who scored similar values, in most of the ages, the Ugandans had the second highest scores with the exception of the 6 year olds where the Mexicans had a slight advantage. This physical capacity within the Cuban population is well development as was the case with the strength endurance of the arms.
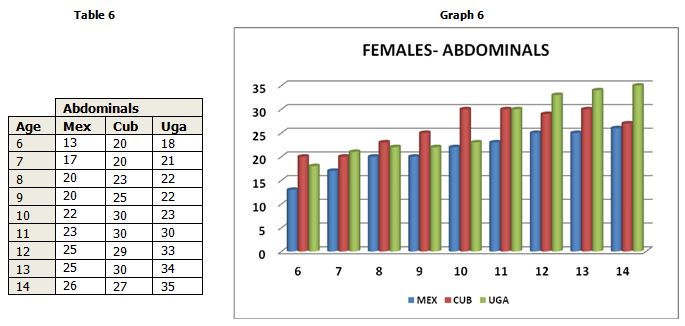
The table 6 and graph 6 below show the 90th percentile of the female students as regards the strength endurance of the abdominal muscles. The results vary according to the different ages where the Cuban had higher score in the 6- 10 year olds with the exception of the 7 year olds where Uganda had a slight advantage of one repetition. Uganda and Cuba had the same score in the 11 year olds while the 12-14 year olds, the results favor Uganda with a very big margin over Cuba and Mexico. In all comparisons, Mexico scored the least. This means that there is more deficiency in abdominal strength endurance levels of the Mexican girls as compared to Uganda and Cuba.
The table 7 and graph 7 below show the 90th percentile of the explosive strength of the lower extremities for the male subjects. In all comparisons, Uganda had higher scores and Cuba in second place. These results are very similar to those attained in the speed test where the majority of the comparisons favored Uganda. This similarity in the results is attributed to the fact that both physical capacities depend on the same energy source during the test i.e. anaerobic- alactic where energy is obtained from a muscle component known as create- phosphate which guarantees energy for very fast contractions that only last a few seconds. Both the long jump and 30 meter sprint test obtained energy this way. This means that Ugandans from this part of the country should be able to perform very well in sports that require fast contractions. The government of Uganda should therefore strategically identify this area as a potential source of sprinters and talent hub for the country when it comes to sports that require fast movements. Cuba closely came in second place in all the cases with Mexico coming third.
As seen in Table 8, graph 8, just like the male students, the Ugandan girls in all ages scored highest in the explosive strength of the legs with bigger margins in most of the ages. The highest margins are observed in the age group of 10-14 years. It shows that both males and females from Bugiri district are naturally endowed in the explosive strength of the legs. The government of Uganda should construct sports facilities in this area giving priority to those sports where this physical capacity is a prerequisite like athletics and tap on the natural talent that lives in this part of the country.
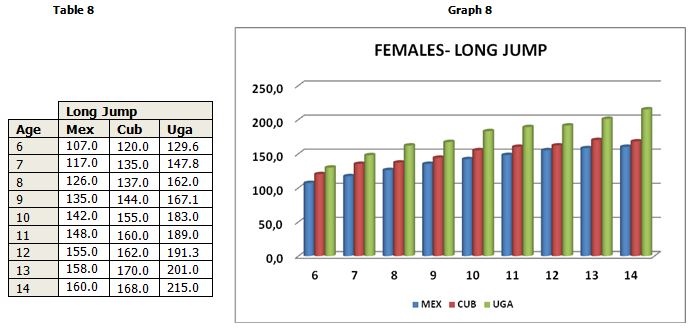
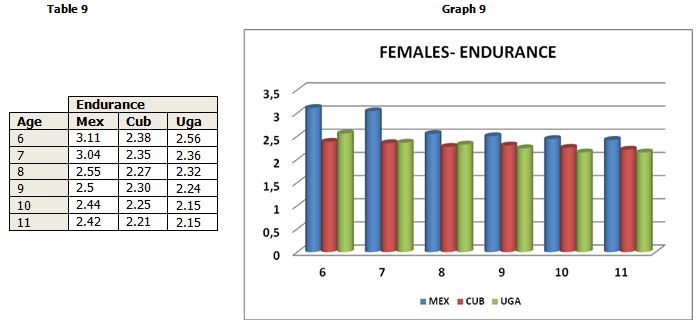
Table 9, graph 9 show the comparisons of the 90th percentile of the females as regards the general endurance. This comparison was made in the children aged 6-11 years only. It was not possible to compare the 12-14 year olds due to the fact the distance used to measure this physical capacity did not coincide in all the countries, whereas in Cuba and Uganda, a 1 km run test was used for the above ages, in Mexico, the distance used was 600 meters hence making it impossible for the comparisons to be made.
The table and graph show that the 90th percentile favors Cuba in the 6-8 year olds although Uganda closely follows and in the third place comes Mexico. However the situation changes where the rest of the comparison i.e. 9-11 years all are in favor of Uganda with Cuba coming very close. The margins are very small between the two countries, in all the case it’s a difference of microseconds and Mexico comes in third place with slightly bigger margins in the time differences. It is important to note that generally there is a progressive increase in the development levels of this physical capacity as the children grow older manifested by the continuous decrease of the 90th percentile scores as the age increases i.e. The older children run the distance in less time than the younger ones.
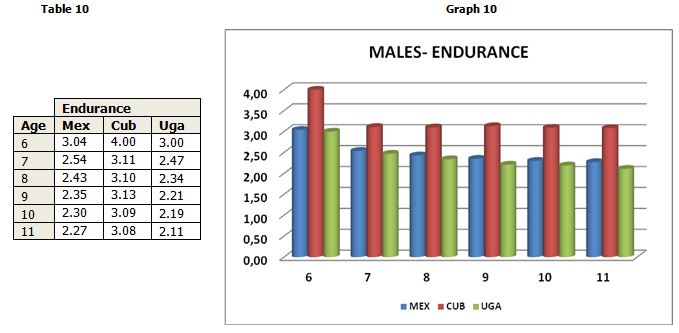
As for the male students, all comparisons of the 90th percentile favored Uganda with Mexico coming in the second place. It is important to note that unlike the females, the Cuban males scored very low in this physical capacity. The difference between Cuba and the other two countries is overwhelming. This raises a lot of concern why this manifestation is only in one sex where the Cuban male students compare more unfavorably than the female students with Uganda and Mexico. Generally, there is a constant improvement in endurance as the age increases across the three countries.
Generally, as seen in the results, the levels of physical fitness vary from one physical component to another within the different age groups in each of the countries, this can be due to a number of factors among which are genetics, environment, infrastructure and the physical education programs that may lead to higher development of one physical fitness component in comparison to another. For instance, if we take a look at the results obtained in speed and explosive strength of the legs, the results are quite similar where Uganda and Cuba performed better than the Mexicans. This reflects genetic characteristics of both populations where the black race is more rampant as was expressed by a neurologist and retired Oxford dean as quoted by Entine (2000) "as a scientist rather than a sociologist" that all athletes are not created equal. "I am prepared to risk political incorrectness", he said, "by drawing attention to the seemingly obvious but under stressed fact that black sprinters and black athletes in general all seem to have certain natural anatomical advantages." It is quite evident in this study that the populations with more black individuals ie. Cuba and Uganda excelled in most physical fitness tests especially those that require speed and explosive strength.
Entine (2000) further quotes the works of Geneticist and exercise physiologist Claude Bouchard of Laval University in Quebec City, who ran several experiments comparing two populations, French-Canadian and West African students. He concluded that the West African students had faster twitch fiber than the white students from Canada by almost a ratio of two to one. Similarly the results in this article show that the populations with more African ancestry excelled in the tests that required fast contractions.
This is further confirmed by Saletan (2008) who said that the black race has got more component of ACTN3, the genetic component for fast muscle contractions, he cites several studies including Human Molecular Genetics report (2003) which reported that Africans and African Americans were more characterized by the RR genotype than the XX in fact by a 4:1 ratio in the Africans and African-Americans than the white people who averaged at less than 2;1 ratio. The RR genotype is associated with the fastest runners and sprinters. The report concluded that persons with African ancestry were more endowed in speed and power sports as is with the case of Cuba and Uganda.
As is the case with speed and explosive strength of the legs, the genetic factor is still a key player in the results obtained in the endurance tests. Most comparisons favored Uganda most especially in the male category. According to Entine (2000), whereas the West Africans are more endowed with Fast Twitch muscle fiber, the East Africans are more talented aerobically. This partially explains the results gotten in the endurance test due to the fact that Uganda is an East African country. He further quotes Timothy Noakes, long-time director of the Sport Science Center at the University of Cape Town Medical School, and author of many scholarly books, including Lore of Running who observed that the black South Africans with an East African Ancestry won 90% of the long distance events over the years in South Africa despite the fact that the blacks constitute not more than one quarter of the active running population in that country. Similarly Saltin (1990), Skinner et al (2001) confirm that the black race responds quickly to endurance training.
One other factor of great importance is that of child obesity, Navarro et al (2004) found out that there was very high overweight and obesity prevalence in Mexican children ranging from 10.8% to 16.1% in boys and 6.8% to 10.8% in girls using the CDC (Centre for Disease Control) criteria. This is a very high index that could perhaps have influenced the low levels of physical fitness in the Mexican children reflected in this comparison.
Conclusions
The study revealed that across the three countries, there is a steady increase in the fitness levels of the children as the age increases. In other wards, the older the children grow, the more their physical fitness increases. This means that the physical education curricula in all the three countries should take advantage of that to ensure constant growth and improvement in their physical fitness and avoid working below their possibilities during then PE classes.
More than half of the comparisons favored Uganda in most of the measured physical capacities, Cuba coming in second place with close to half of the comparison and Mexico in third place. It is important to note however, that despite the fact that Ugandan population compares favorably in physical fitness level against countries like Cuba, Mexico which are known to be very good sporting countries at international level, Uganda does not perform that well in international competitions ie. Olympics and world championships. This means that the government of Uganda and all stakeholders should take advantage of the untapped potential in the Ugandan population for high performance in sports.
Recommendations
-
There is need for the various countries to review their physical education curriculums with the aim of putting more emphasis on those physical fitness components in which their citizens did not compare favorably.
-
The government of Uganda should lay strategies to tap on the potential talents that go wasted in the various parts of the country since the population’s physical fitness standards are up to international level and in some cases over it.
Bibliography
-
Blázquez. D. (1997). Evaluar en Educación Física. Barcelona: INDE Publicaciones.
-
Blázquez. D. (1986). Iniciación a los deportes de equipo. Barcelona: Martínez Roca.
-
Blázquez. S.D. (1995). La Iniciación Deportiva. Barcelona: INDE Publicaciones.
-
Bompa. T (1987). La selección de atletas con talento. Revista de Entrenamiento Deportivo. Volumen Nº 2.
-
Brotons. J. M. (2005). Propuesta de un modelo integral para el proceso de detección, selección y desarrollo de talentos deportivos a largo plazo. Lecturas: Educación Física y Deportes, Revista Digital. Buenos Aires, Año 10 - N° 91 – Diciembre. http://www.efdeportes.com/efd91/selec.htm
-
Campos, J. (1996). Indicaciones para la selección de talentos deportivos. Madrid: Consejo Superior.
-
Canada Fitness (1986). Canadian Standardized Test of Fitness Operation Manual. 3rd edition. Ontario, Government of Canada: Fitness and Amateur Sport.
-
Capetillo, R. (2006). La detección de talentos en Tenis. Lecturas: Educación Física y Deportes, Revista Digital. Buenos Aires, Año 11, N° 97, Junio. http://www.efdeportes.com/efd97/tenis.htm
-
Casco, P. (2001). O Esporte Escolar e a Experiência Democrática. Lecturas: Educación Física y Deportes, Revista Digital. Buenos Aires, n° 36. http://www.efdeportes.com/efd36/democr.htm
-
Colectivo de autores (2003). Folleto de la metodología de investigación. EIEFD.
-
Corzo, A. y Pérez, C. (2003). La iniciación deportiva de los mejores levantadores de pesas en Cuba. Lecturas: Educación Física y Deportes, Revista Digital. Buenos aires. Año 9, N° 60, Mayo. http://www.efdeportes.com/efd60/pesas.htm
-
Cruz. L. (1990). Un criterio para la selección de talentos. Tesis de Doctorado. Universidad de La Habana.
-
Cuadro, H. (2002). Un nuevo enfoque sobre los criterios de selección en el fútbol. Lecturas: Educación Física y Deportes, Revista Digital. Buenos Aires, Año 8, N° 48, Mayo. http://www.efdeportes.com/efd48/selec.htm
-
De Armas, R. (1996). Valoración metodológica de las pruebas generales y específicas que se aplican en la investigación de las reservas deportivas cubanas. ISCF.
-
Dosil, J. (2001). Detección de Talentos deportivos. Psicología y deporte de iniciación. Ourense: Edit. Gersam, 79-92.
-
Entine, J. (2000). The Story Behind the Amazing Success of Black Athletes. http://run-down.com/run-down.css
-
Estévez, M. y col. (2006). La Investigación Científica en la Actividad Física: su Metodología. La Habana: Edit. Deportes.
-
Feu, S. (2001). Criterios metodológicos para una iniciación deportiva educativa: una aplicación al balonmano. Lecturas: Educación Física y Deportes, Revista Digital. Buenos Aires, Año 6, Nº 31. http://www.efdeportes.com/efd31/balonm.htm
-
Fisher, R.J. y Borms, J. (1990). The search for sporting excellence. Schorndorf, FRG: Verlag Karl Hoffman.
-
Fuentes, A.P. (2003). Condición física saludable. Una experiencia en la población adulta laboral en la ciudad de Cienfuegos. Tesis Doctoral.
-
Navarro, B. et al (2004). The high prevalence of overweight and obesity in Mexican children. http://onlinelibrary.wiley.com
-
Pila, H. y Hernández, G. (2000). Métodos y Normas para evaluar la Preparación Física y seleccionar Talentos Deportivos. Mixhuca: Ed. Supernova.
-
Pila, H. y Mukana, R. (2009). Normas de evaluación de la condición física y detección de talentos, una experiencia cubana aplicada en la comunidad de Busowa, Bugiri, Uganda. Primera parte. Lecturas: Educación Física y Deportes, Revista Digital. Buenos Aires, Año 14, Nº 134, Julio. http://www.efdeportes.com/efd134/deteccion-de-talentos-en-uganda.htm
-
Pila, H. y Mukana, R. (2009). Normas de evaluación de la condición física y detección de talentos, una experiencia cubana aplicada en la comunidad de Busowa, Bugiri, Uganda. Segunda parte. Lecturas: Educación Física y Deportes, Revista Digital. Buenos Aires, Año 14, Nº 135, Agosto. http://www.efdeportes.com/efd135/condicion-fisica-y-deteccion-de-talentos.htm
-
Saletan, W. (2008). White men can’t jump race, gene, sports. http://www.slate.com/articles/health_and_science
-
Skinner, J. et al (2001). Age, sex, race, initial fitness and response to training: the heritage family study. J Appl Physiol. May;90(5):1770-6.
Another articles in English
|
|
|
|---|---|
|
EFDeportes.com, Revista
Digital · Año 21 · N° 220 | Buenos Aires,
Septiembre de 2016 |
|