
|
|||
|---|---|---|---|
|
|
Energetic routes and fatigue in soccer Las vías energéticas y la fatiga en el fútbol |
|
|
|
*Graduated in Sports Science. Graduated in Physical Education Catholic University of Valencia. UCV High Performance in Soccer. University of Granada II Level Trainer of Soccer **Graduated in Sports Science. University Pablo de Olavide, Seville High Performance in Soccer. University of Granada II Level Trainer of Soccer |
Rafael Ballester Lengua* Víctor López García** (Spain) |
|
|
|
Abstract Soccer is an intermittent sport. Players perform low-intensity activities for the major part of the game although heart rate and body temperature measurements suggest that the average oxygen uptake during the match for elite soccer players is around 70% of their VO2max. This may be explained by the high number of brief intense actions a top-class player performs during a game, which also indicates that the rates of creatine phosphate (CP) utilization and glycolysis are frequently high during a game. Muscle glycogen is probably the most important substrate for energy production, and fatigue towards the end of a game may be related to depletion of glycogen in some muscle fibres. Blood free-fatty acids (FFAs) increase progressively during a game, partly compensating for the progressive lowering of muscle glycogen. Fatigue also occurs temporarily during matches, but it is still unclear what causes the reduced ability to perform maximally. To know about all these issues we have been working with some that analyse the metabolic routes used by the players and some of the influential variables in the fatigue, such as position, standard of play, moment of the game or type of competition. Keywords: Soccer. Fatigue. Energetic routes. High intensity. Small-sided games.
|
|||
|
|
EFDeportes.com, Revista Digital. Buenos Aires, Año 18, Nº 187, Diciembre de 2013. http://www.efdeportes.com/ |
|
|
1 / 1
1. Aerobic energy production in soccer
Aerobic performance is determined by aerobic power and aerobic capacity. The ability to produce aerobic energy at a high rate and is characterized by maximal oxygen intake (VO2max). Aerobic capacity expresses the ability to sustain exercise.
Here we show a study reported by Reilly (2005), which indicate the mean maximal oxygen uptake (VO2max) measured in professional soccer teams in Europe.
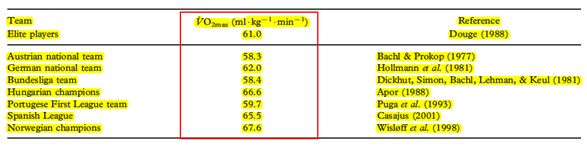
Source: Reilly, 2005
Soccer is an intermittent sport in which the aerobic energy system is highly taxed, with mean and peak heart rates of around 85 and 98% of maximal values (Krustrup et al., 2005). Nevertheless, with these factors taken into account, the heart rate measurements during a game seem to suggest that the average oxygen uptake is around 70% VO2max(Jens Bangsbo, Mohr & Krustrup, 2006).
More important for performance than the average oxygen uptake during a game, may be the rate of rise in oxygen uptake during the many short intense actions. A player’s heart rate during a game is rarely below 65% of maximum, suggesting that blood flow to the exercising leg muscle is continuously higher than at rest, which means that oxygen delivery is high. However, the oxygen kinetics during the changes from low to high-intensity exercise during the game appear to be limited by local factors and depend, among other things, on the oxidative capacity of the contracting muscles (Bangsbo et al., 2006; Krustrup, Hellsten & Bangsbo, 2004).
2. Anaerobic energy production in soccer
When considering anaerobic performance, a distinction has to be made between anaerobic power and anaerobic capacity. Anaerobic power represents the highest rate of anaerobic energy release, whereas anaerobic capacity respects the maximal anaerobic energy production an individual can obtain in any exercise bout performed to exhaustion (Bangsbo at al., 2006).
Elite soccer players perform 150-250 brief intense actions during a game (Mohr, Krustrup & Bangsbo, 2003). This indicates that the rate of anaerobic energy turnover is high at certain times leading to a high rate of creatine phosphate breakdown, which is resynthesized in the following low intensity exercise periods (Bangsbo, 1994). Thus, creatine phosphate may decline during parts of a game if a number of intense bouts are performed with only short recovery periods. Analysis of creatine phosphate in muscle biopsies obtained after intense exercise periods during a game have provided values above 70% of those at rest, but this is likely to be due to the delay in obtaining the biopsy (Krustrup et al., 2006).
Mean blood lactate concentrations of 2-10 mmol/L have been observed during soccer games, with individual values above 12 mmol/L (Bangsbo, 1994; Krustrup et al., 2006). These findings indicate that the rate of muscle lactate production is high during match-play, but muscle lactate has been measured just once in this condition. It was in a friendly game between non-professional teams and it was observed that muscle lactate rose fourfold (around 15 mmol) compared with resting values after intense periods in both halves, with the highest value being 35 mmol (Krustrup et al., 2006).
An interesting finding in that study was that muscle lactate was not correlated with blood lactate. This is in contrast to continuous exercise where the blood lactate concentrations are lower but reflect well the muscle lactate concentrations during exercise.
These differences between intermittent and continuous exercise are probably due to different turnover rates of muscle lactate and blood lactate during the two types of exercise, with the rate of lactate clearance being significantly higher in muscle than in blood (Bangsbo, Johansen, Graham, & Saltin, 1993). This means that during intermittent exercise in soccer, the blood lactate concentration can be high even though the muscle lactate concentration is relatively low. The relationship between muscle lactate and blood lactate also appears to be influenced by the activities immediately before sampling (Krustrup & Bangsbo, 2001).
Thus, the rather high blood lactate concentration often seen in soccer (Bangsbo, 1994; Krustrup et al., 2006) may not represent a high lactate production in a single action during the game, but rather an accumulated/balanced response to a number of high-intensity activities.
3. Fatigue during a soccer game
The international top-class player performs approximately 1350 activities during a game, including about 220 runs at high speed (Mohr et al., 2003). All the actions are performed during the game producing fatigue during a game and the physiological mechanisms that may impair a player’s physical performance.
3.1. Development of fatigue in high-standard soccer players according to the playing position
Time-motion analysis is useful for examining the activity pattern and physical aspects of soccer (Reilly and Thomas, 1976; Bangsbo, 1994).Using time-motion analysis, it has been demonstrated that elite players typically cover a total distance of 9-12 km during a game (Mohr et al., 2003). The type of exercise performed in soccer is intermittent, with a change in activity every 4-6 s (Bangsbo, 1994; Mohr et al., 2003; Reilly & Thomas, 1976). Thus, an international top-class player performs approximately 1350 activities during a game, including about 220 runs at high speed (Mohr et al., 2003).
As a brief introduction we could say that the typical distance covered by a top-class outfield player during a match is 9-12 km, with midfield players covering greater distances than other outfield players. However, most of this distance is covered by walking and low-intensity running, which require a limited energy turnover.
In a recent study Bradley & Krustrup (2009), examined, using Pro Zone, the activity profiles of a large sample of English FA Premier League soccer players. The results concerned to distance covered were the followings:
Mean total distance covered during a match was 10,714 m (s=991). The distance covered during the first half was greater than during the second half of a match (5422 m, s=561 vs. 5292 m, s=508, P<0.01). Greater distances were covered in the first half than the second half when jogging and running whereas the distance covered when walking was greater in the second than in the first (1929 m, s=145 vs. 1889 m, s=183, P<0.01). There were no differences between first and second half distance for high-speed running and sprinting.
In terms of energy production, the high-intensity exercise periods are very important. Moreover, it should be emphasized that the recordings of high-intensity running do not include a number of energy-demanding activities such as short accelerations, tackling, and jumping. The number of tackles and jumps depends on the individual playing style and position in the team.
A study carried out by Mohr et al. (2003) using time-motion analysis at two high standards of professional soccer and no elite teams, establishes a relationship between top class elite players and non elite players dividing locomotor activities in four categories: standing; walking; low-intensity running, encompassing jogging, low-speed running and backward running; and high-intensity running, consisting of moderate-speed running, high-speed running and sprinting (Km/h).
The amount of high-intensity running, independent of competitive standard and playing position, was lower in the last than in the first 15 min of the game.
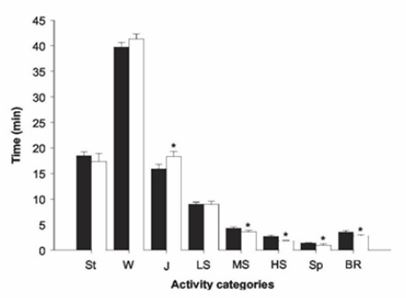
Source: Mohr et al., 2003. Locomotor categories for top-class players and moderate players during a soccer game expressed as total time:
St =standing; W=walking; J= jogging; LS, MS and HS= running at a low, moderate and high speed, Sp= sprinting; BR=backwards running.
The top-class players performed 28% and 58% more high-intensity running and sprinting, respectively, than the moderate players (2.43±0.14 vs 1.90±0.12 km and 0.65±0.06 vs 0.41±0.03 km, respectively).
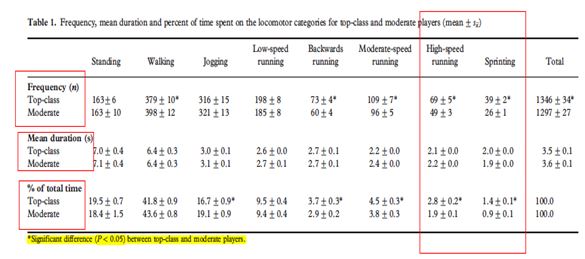
Source: Mohr et al., 2003
According to play position there was no difference in the total distance covered or the distance covered in high-intensity running between the other three positions. On the other hand, the attackers and the full-backs covered a greater distance when sprinting than the midfield players and defenders. There was no difference between the full-backs and the attackers or between the midfield players and the defenders.
All players in both groups showed a reduction in high-intensity running in the second compared with the first half.
Significantly the attackers showed a greater decline in sprinting distance from the first to the second half than the defenders and the midfield players. Aspect to be consider in our training.
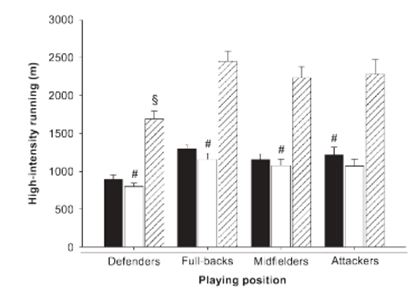
Source: Mohr et al., 2003
3.2. Temporary fatigue during a game
Studies have demonstrated that the amount of sprinting, high-intensity running and distance covered are lower in the second half than in the first half of a game (Bangsbo, 1994; Mohr et al., 2003; Reilly & Thomas, 1976).
In a study, top-class professional male players were examined in competitive games at the highest international level by the use of time-motion video analysis (Mohr et al., 2003); reported that the amount of high intensity running in the 5-min period immediately after the most intense 5-min interval recorded during the game was observed to be less than the average of the entire game.
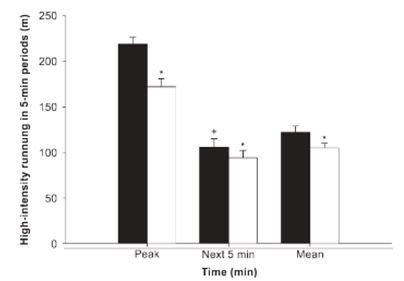
Source: Mohr et al., 2003.Black: top-class player; white: moderate players
In our view this finding indicates that performance was reduced after a period of intense exercise, which could have been a result of the natural variation in the intensity in games due to tactical or psychological factors.
Therefore, it could be suggested that temporary fatigue during a game may be related to high muscle lactate concentrations and/or muscle acidosis, since it has been demonstrated in vitro that high lactate and low pH impair muscle performance during intense contractions (Fitts., 1994). However, muscle lactate concentrations during the game were rather low, compared with those found at exhaustion after high-intensity exercise (Bangsbo et al., 1992a; Bangsbo et al., 1992b)
Furthermore, in a study using the Yo-Yo intermittent recovery test, in which athletes perform intense intermittent exercise to exhaustion, muscle lactate and pH recorded 1.5 min before the point of fatigue were not different from those seen at exhaustion (Krustrup et al., 2003). Thus, it is unlikely that elevated muscle lactate and lowered muscle pH cause fatigue during a soccer game.
Together, these findings suggest that temporary fatigue in soccer is not causally linked to high muscle lactate, high muscle acidosis or low muscle creatine phosphate.
It has been suggested that the development of fatigue during high-intensity exercise is related to an accumulation of potassium in the muscle interstitium. (Mohr et al., 2003)
At the point of exhaustion after intense short-term exercise (* 5 min), the interstitial potassium concentration is elevated to around 12 mmol (Mohr et al., 2004), which according to in vitro studies is high enough to depolarize the muscle membrane potential and reduce force development markedly. Thus, soccer players may experience temporary fatigue as a consequence of accumulation of extracellular potassium and concomitant electrical disturbances in the muscle cell.
3.3. Fatigue at the end of a game
The amount of high-intensity exercise declines towards the end of a match observed that for both top-class players and professional players of a lower standard, the amount of high-intensity running was reduced in the last 15 min of a game. (Mohr et al, 2003)
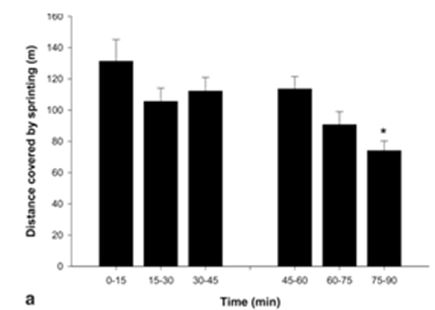
Source: Mohr et al., 2003
Furthermore, only 3% of the players had their most intense exercise period in the last 15 min of the game, and more than 40% of the players had their least intense exercise period in the last 15 min.
Apparently, most players experience fatigue towards the end of the game. Accordingly, the ability to perform repeated sprints was reduced after compared with before a game (Krustrup et al., 2003) Furthermore, it was observed that substitutes who came on in the second half sprinted and ran at a high intensity (63 and 25% more, respectively) than players who played the entire game.
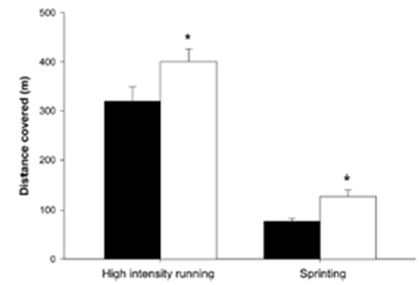
Source: Mohr et al., 2003. High-intensity running and sprinting during the final 15 min of a game
by players participating in the entire game; and substitutes only participating in the second half*.
Some authors (Krustrup et al., 2003; Mohr, Krustrup, Nybo, Nielsen & Bangsbo, 2004) affirm the reduction in exercise intensity and sprint performance in the final phase of games is independent of playing position, level of competition and gender, indicating that most players utilize their physical potential during a game
Blood samples taken during soccer games have shown that blood lactate concentration declines in the later stages of a game, whereas plasma free fatty acids are increased. An increasing lipid turnover during the game may be induced by low muscle glycogen concentrations together with elevated concentrations of catecholamine (Bangsbo, 1994; Krustrup et al., 2003)
Another important reason may be the concentration blood glucose and muscle glycogen. Recently, muscle tissue obtained before and after soccer game was analysed for muscle fibre type specific glycogen depletion, using the PAS staining technique (Krustrup et al., 2003).
It was shown that after the game about half of the type I and type IIA fibres were almost or completely depleted of muscle glycogen. Thus, fatigue at the end of soccer games may be caused by glycogen depletion of individual muscle fibres. Hypoglycaemia has also been suggested to cause fatigue during long-term exercise, but the blood glucose concentration does not reach critical values during a soccer game (Bangsbo, 1994; Ekblom, 1986; Krustrup et al., 2003).
Other factors such as dehydration and hyperthermia have also been suggested as agents responsible for the development of fatigue in the later stages of a soccer game (Reilly, 1997).
3.4. Impaired performance in the initial phase of the second half
It has been shown that top-class male soccer players perform less high-intensity running in the first 5 min of the second half compared with the first half In the following two 5-min periods, no differences were found between the two halves (Mohr et al., 2003)
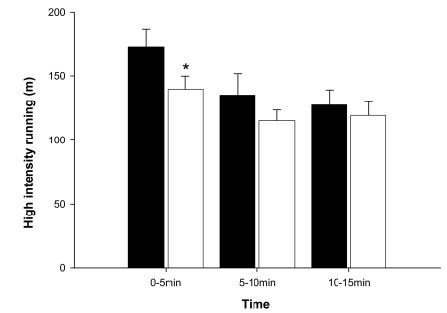
Source: Mohr et al., 2003
Several studies have found a close relationship between muscle temperature and high-intensity exercise performance. The study, it was shown that muscle temperature was higher than 39ºC after a proper warm-up before a soccer match and that it remained at this level throughout the first half. However, during the half-time break, muscle temperature declined by around 28 C when the players carried out their normal routines.
The players also performed a sprint test before as well as after each half; the ability to sprint repeatedly was unchanged at the end of the first half, but after the half-time break sprint performance had deteriorated.
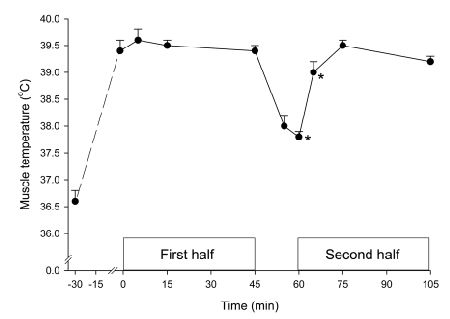
Source: Mohr et al., 2004
These results indicate that soccer players perform better physically when they prepare for the second half by re-warming at half-time, which appears to be related to a high maintained muscle temperature.
In our opinion, a short warning-up of 2-3 minutes may help to begin the second half in optimum temperature and therefore in better conditions.
3.5. Conclusion
-
Top-class soccer players performed more high-intensity running during a game than moderate professional players.
-
Total distance covered and distance covered in running and high-intensity running depends on playing positions.
-
Fatigue occurred towards the end of matches as well as temporarily during the game, independently of competitive standard and of team position.
-
Multiple factors as muscle lactate, high muscle acidosis, low muscle creatine phosphate or accumulation of potassium in the muscle interstitium cause the temporary fatigue in soccer.
Soccer is characterized by a high number of high-intensity exercise bouts. It is vital that players develop the ability to repeatedly perform acute bouts of intense exercise during long periods of time. This outcome can be achieved by conducting frequent sessions of aerobic high-intensity and speed-endurance training specific of the physical, technical and tactical demands of the game.
References
-
Bangsbo, J., Graham, T. E., Kiens, B., & Saltin, B. (1992). Elevated muscle glycogen and anaerobic energy production during exhaustive exercise in man. The Journal of Physiology, 451(1), 205-227.
-
Bangsbo, J., Graham, T., Johansen, L., Strange, S., Christensen, C., & Saltin, B. (1992). Elevated muscle acidity and energy production during exhaustive exercise in humans. American Journal of Physiology-Regulatory, Integrative and Comparative Physiology, 263(4), R891-R899.
-
Bangsbo, J., Johansen, L., Graham, T., & Saltin, B. (1993). Lactate and H+ effluxes from human skeletal muscles during intense, dynamic exercise. The Journal of Physiology, 462(1), 115-133.
-
Bangsbo, J. (1994a). Energy demands in competitive soccer. Journal of Sports Sciences, 12, S5-S12.
-
Bangsbo, J., Mohr, M., & Krustrup, P. (2006). Physical and metabolic demands of training and match-play in the elite football player. Journal of sports sciences, 24(7), 665-674.
-
Bansbo, J., Rampinini, E., Iaia, F.M. (2009). High-Intensity Training in football. International Journal of Sports Physiology and Performance. 4, 291-306.
-
Bangsbo, J., Madsen, K., Kiens, B., and Richter, E. A. (1996). Effect of muscle acidity on muscle metabolism and fatigue during intense exercise in man. Journal of Physiology (London), 495, 587 – 596.
-
Bradley, P. S., Sheldon, W., Wooster, B., Olsen, P., Boanas, P., and Krustrup, P. (2009). High-intensity running in English FA Premier League soccer matches. Journal of Sports Sciences, 27, 159–168.
-
Carli, G., Bonifazi, M., Lodi, L., Lupo, C., Martelli, G. and Viti, A. (1986). Hormonal and metabolic effects following a football match. International Journal of Sports Medicine, 7, 36-38.
-
Di Salvo, V., Gregson, W., Atkinson, G., Tordoff, P., & Drust, B. (2009). Analysis of high intensity activity in Premier League soccer. International Journal of Sports Medicine, 30, 205–212.
-
Di Salvo, V., Baron, R., Tschan, H., Calderon Montero, F. J., Bachl, N., & Pigozzi, F. (2007). Performance characteristics according to playing position in elite soccer. International Journal of Sports Medicine, 28, 222–227.
-
Fitts, R. H. (1994). Cellular mechanisms of muscle fatigue. Physiological reviews, 74(1), 49-94.
-
Krustrup, P., & Bangsbo, J. (2001). Physiological demands of top-class soccer refereeing in relation to physical capacity: effect of intense intermittent exercise training. Journal of Sports Sciences, 19(11), 881-891.
-
Krustrup, P., Mohr, M., Steensberg, A., Bencke, J., Kjaer, M., Bangsbo, J. (2006). Muscle and blood metabolites during a soccer game: implications for sprint performance. Medicine Sciences Sports Exercise. 38, 1165–117
-
Montanari, G., Vecchiet, L. and Campo, J.R.R. (1990). Structural adaptments of the muscle soccer players. In Sports Medicine Applied to Football (edited by G. Santilli), pp. 169-179. Rome: CONI.
-
Mohr, M., Krustrup P. and Bangsbo, J. (2003). Match performance of high-standard soccer players with special reference to development of fatigue. Journal Sports Sciences. 21, 519–528.
-
Rampinini, E., Coutts, A. J., Castagna, C., Sassi, R. and Impellizzeri, F. M. (2007). Variation in top level soccer match performance. International Journal of Sports Medicine, 28, 1018-1024.
-
Reilly, T., & Thomas, V. (1976). A motion analysis of work-rate in different positional roles in in professional football match-play. Journal of Human Movement Studies, 2, 87–89.
-
Reilly, T. (1994b). Physiological aspects of soccer. Biology of Sport, 11, 3-20.
-
Reilly, T. (2005). An ergonomics model of the soccer training process. Journal Sports Sciences. 23, 561–572.
Another articles in English
| |

Búsqueda personalizada
|
|---|---|
|
EFDeportes.com, Revista
Digital · Año 18 · N° 187 | Buenos Aires,
Diciembre de 2013 |
|