
|
|||
|---|---|---|---|
|
|
The effect of different models of training and competition-load structuration in the acceleration of adult male high level basketball players |
|
|
|
Alexandre Moreira1,3 | Alexandre Hideki Okano2,3 Enio Ricardo Vaz Ronque2,3 | Marcel de Souza5 Paulo Roberto de Oliveira2,4 mv-cpfi@uol.com.br |
|
|
|
|
|||
|
|
http://www.efdeportes.com/ Revista Digital - Buenos Aires - Año 12 - N° 117 - Febrero de 2008 |
|
|
1 / 1
Introduction
A basketball game can be considered a complex collective modality, emphasizing the competition among basketball players from opponent teams. This competition is characterized by the intense opposition between the teams with common objectives, that is, the performance of rapid defensive adjustments in order to avoid the offensive games of the opponents.
The optimum output for this objective is determined by an interaction of factors, which include technique and physical conditioning and also the level of the physical conditioning, permitting the stability of the technique during the entire game, repeating the high-intensity actions innumerous times with an elevated degree of precision.
These different parts, factors or components of the preparation of basketball players must be objects of training during a macrocycle, or an annual cycle, or even in a preparation of long years. However, at times, negative interactions may occur from the attempt to train different components without a rational organization with respect to the sequence of the content.
Therefore, it is possible to affirm that the integration of the different parts of a preparation, as well as output-control tests to observe the basketball players' reactions when submitted to the different training contents, are fundamental for the design and analysis of the training process.
One of the most relevant adaptation reactions or responses for high-performance basketball players is in regard to the capacity to develop velocity in a short time. Frequently, this characteristic is denominated acceleration (Cronin &, Hansen, 2006), or yet, when analyzed for short distances, with change of direction, cyclical-acyclical displacement velocity (Moreira , 2002; Moreira et al., 2005a, 2005b) and agility (Miller et al., 2006).
Maximum velocity will not be reached in basketball and the basketball player must repeat these acceleration efforts many times, especially including those performed for abrupt stops and rapid changes in direction.
Thus, it is reasonable to admit that the control tests which contemplate the evaluation of the level of this capacity, as well as permit the accompaniment of their behavior during a season, are a fundamental factor for an optimum design and an effective structuration.
One of the tests most utilized by specialists with this objective is called test T, initially proposed by Semenick (1990) and performed to evaluate this characteristic, inherent to the capacity to rapidly perform a velocity effort in a short period of time, with changes in direction (Cronin, McNair & Marshall, 2001; Miller et al., 2006; Pauole et al., 2000; Tsitskaris Theoharopoulos & Garefis, 2003).
However, the dynamic (behavior) of this marker during a macrocycle in high-level basketball players has not been the object of investigation, nor has the analysis of this behavior decurrent from different structurations (forms of organization and sequence of the means and methods of training).
Therefore, the objective of the present study was the evaluation of dynamic (behavior) of acceleration (cyclical-acyclical displacement velocity) during a macrocycle of training in 32 high-level, adult male basketball players, divided into three groups and submitted to three different models of structuration, assuming the T test as a functional external marker of the capacity to perform the acceleration efforts (cyclical-acyclical displacement velocity).
MethodsSubjects
The casual, non-probabilistic method was utilized for the selection of the sample of individuals from whom data were collected. Therefore, the sample was composed of 32 (thirty-two) male athletes, adult category, main Brazilian division (A1). The groups (Models) had been investigated in championships in previous years. The profile of the sample, for age, corporal mass and stature is: Selective-load model (SLM) (N = 9); 25,22 ± 3,56 years, 87,70 ± 6.97kg and 193 ± 9.49cm, Concentrated-load model (CLM) (N=10); 23,90 ± 3.90 years, 87,70 ± 12,02kg and 192 ± 10,11cm., Complex-load model (CXM) (N=13); 23,85 ± 3,29 years, 92,32 ± 9,31kg and 194 ± 9,35cm.
All of the athletes signed a term of free and clarified consent, approved by the Committee of Ethics in Research of UNICAMP's Faculty of Medical Sciences (CEP). The study was approved by the CEP; the report on the project was registered under No 101/2005
ProceduresDuration of the preparatory and competition phases
In the three Models studied, the duration of the PP was 6 (six) weeks. In the SLM, the CP had the duration of 18 (eighteen) weeks, the same period observed for the CXM, and a total of 16 (sixteen) weeks dedicated to the CLM.
Moments of data collection (control tests)
Beginning of the PP (T0), end of the PP (T1), end of the first half of the CP (T2), end of the CP (T3)
Standardization of the Control-Test Application CriteriaWith the objective of standardizing the application criteria of the control tests in four moments for the three Models investigated, the following aspects were controlled: location where the control tests were carried out, the same evaluator for the control tests at all moments of collection in the three Models studied; the tests were always applied at the habitual training time for each team, with standard warm-up.
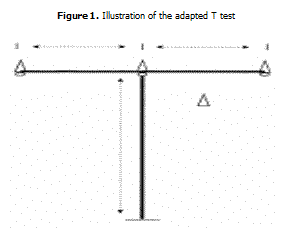
Cyclical-Acyclical displacement velocity (CAV): description40-meter adapted T test (C40): the athlete is in a standing position behind the start/finish line. The "attention" command was utilized, with the evaluator already lowering his arm concomitantly with the verbal command. The athlete ran in a straight line, covering a distance of 10 meters (m) to the line demarcated with a cone; he stepped on the line and changed direction to the left without crossing his legs (abrupt stop followed by a change of direction); therefore, he covered a distance of 5m to the other line, also demarcated with a cone; when stepping on this line, the athlete returned in the previous direction, going however to the other extreme of the T. In this manner, he covered 10m more (5m to the central cone, plus 5m to the right-side cone); when stepping on the line (to the right), the athlete returned to the central cone, covered a distance of 5m and then went to the start-finish line, totaling 40m with 4 abrupt stops, followed by rapid and explosive changes in direction (Figure 1). Three repetitions were performed, with intervals of 2 to 3 minutes. The arithmetical average of the two best attempts was considered. A manual Timex stopwatch was utilized. The intraclass coefficient (ICC) was 0.90 between attempts.
Experimental designThe subjects were divided into three groups with distinct periodization strategies (Models); one group, denominated selective-load Model, structured according to the proposal of Gomes (2002) and Moreira et al. (2005b) which presents an organization with a tendency to be a more diluted and parallel work than that performed for the concentrated-loads Model and the complex-loads Model. The concentrated-loads Model followed the proposal defended by Moreira et al. (2004) and Moreira (2002) for basketball; the complex-loads Model was characterized by a preparatory phase similar , in terms of content, to the CLM (concentration of the strength loads) and later (competition phase) assumed an organization similar to the SLM.
In the three Models studied, the duration of the preparatory phase was 6 weeks. In the SLM, the competition phase lasted for 18 weeks, the same period observed for the CXM, a total of 16 remaining weeks destined to the competition phase that included 6 weeks of the special phase and 10 weeks of the actual competition phase for the CLM. The average of games played per week during the competition phase was 2 games for the CLM and CXM and 1.4 for SLM.
The main methods of training were divided into groups in order to verify the emphasis of their utilization in each phase (percentage of utilization in each phase in relation to the total), which characterized the nature and structure of each investigated Model. The groups of methods, however, were divided into special-endurance training: collective, official and friendly games, reduced games, continuous variation method, extensive intervalled and short intensive intervalled (Moreira, 2002); for the resistance exercises, the training methods were divided in maximum efforts (1-5RM), extensive repeated efforts (10-15RM), intensive repeated efforts (6-12RM) sub maximum (10-15 not until failure) and explosive efforts and, finally, the jumps were classified as simple jumps, jumps with a bar or deep jumps. In this way, the distribution of the groups of methods characterized the particularities of each model, that is, concentrated, selective or complex loads (APPENDIX A, B AND C). This "practical" design, including the methods and percentage of utilization in each phase of the preparation never was showed in Brazil with high level basketball players .
StatisticsThe data are presented as minimum, maximum, mean, standard deviation and confidence interval (CI 95%) values in the four moments of collection for the three Models investigated, for the gross values. Also through the descriptive statistic, the magnitude of the treatment's effect (% of variation) between two moments was revealed for four pairs of moments, with the data being observed in relation to the greatest and smallest value, mean, standard deviation and confidence interval 95%.
Example of the calculation:
[((meanT1-meanT0)/meanT0) x 100].
Gaussian distribution was observed for all of the moments through the Shapiro-Wilk test. The analysis of variance of repeated measurements with the objective of 1) testing the hypothesis that the three groups presented the same distribution at the four moments of data collection for gross values and with respect to the percentage of variation among the moments (magnitude of the effect), 2) identifying the difference among the related observations (T0-T1-T2-T3) within each Model. Tukey's HSD test was utilized when necessary to make comparisons between the two Models and to locate the differences between two moments. The significance level was established at 5%. In the case of violation of the presupposition of sphericity, the significance was established by utilizing the Greenhouse-Geisser procedure.
ResultsOn Table 1, the gross values (in seconds) of the four moments are presented for the subjects of the SLM, CLM and CXM, respectively, in relation to the mean (X), inferior (IL) and superior (SL) limit of 95% CI, minimum and maximum values, as well as the standard deviation (SD).
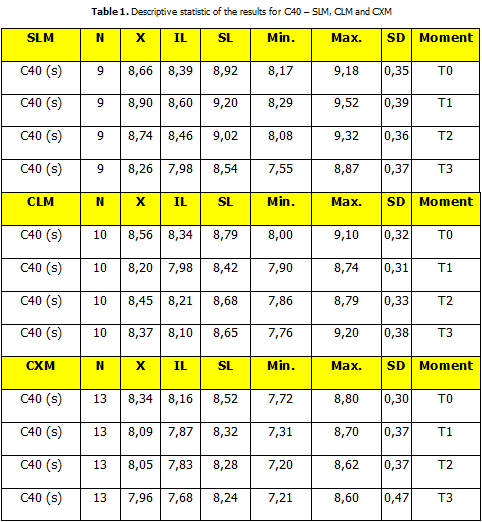
At moment T0, the null hypothesis that no difference exists among the groups (P > 0.05) is accepted. At the end of the preparatory phase (T1) and at the end of the first half of the competitive phase (T2), the models (teams) present statistically significant differences for the gross values. At the last moment of the collection (T3), as observed in T0, the distribution for the three Models can be considered equal, once again accepting the null hypothesis: there was no difference among the groups.
Based on these findings, we sought to identify among the samples, in a paired form, which Models presented differences in C40 at the T1 and T2 moments. The results of the Tukey HSD test showed that the SLM differed in T1 for CLM as well as CXM (P < 0.05). No difference was identified between CLM and CXM at this time. In T2, differently from the result found for T1, the CXM differed from CLM and SLM (P < 0.05).
In relation to the magnitude of the effect (percentage of alteration) between the T0-T1 moments, the SLM differed from the CLM and CXM (P < 0.05) while between T1-T2 for SLM and CXM, no statistically significant difference was observed. On the other hand, SLM differed from CLM at this moment (P < 0.5).
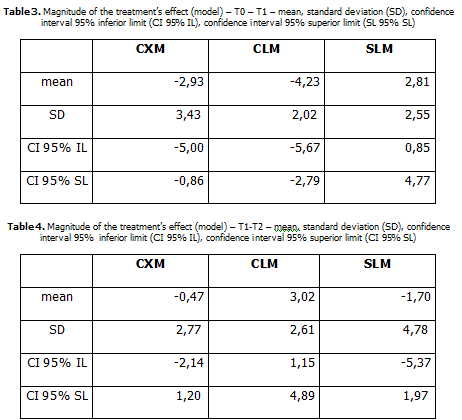
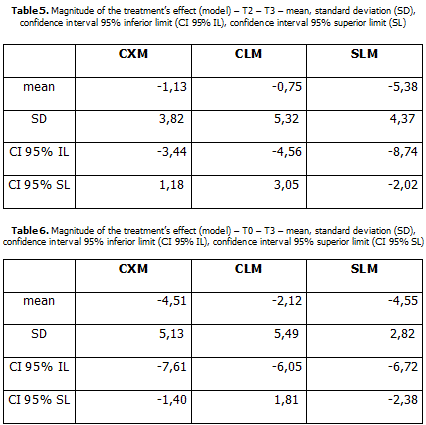
For the statistical analysis of the alteration of gross values during the period in each one of the three investigated Models, the ANOVA for repeated measurements was utilized and revealed statistically significant alteration for the C40 in all of the three Models. On Table 2, the location of these differences is observed in relation to the pairs of investigated moments. On Tables 3, 4, 5 and 6, the magnitude of effect (percentage of alteration) among the pairs of analyzed moments is shown for mean, standard deviation and 95% CI, superior and inferior limit.

DiscussionThe T test, proposed by Semenick (1990), was adapted (originally 9.14m "forward", to 10.0m "sideways", originally 4.57m, adapted to 5m) and utilized in the present study to mark the velocity of cyclical-acyclical displacement (C40), in other words, a mark of acceleration with changes in direction, running forward, from one side to the other and returning to the initial position, characteristics associated to the needs of a basketball game.
The fidedignity of the C40 results, where internal consistence is concerned, that is, in that which concerns the degree of the subject, is consistent in its performance of "attempt" to "attempt" in the same session or day Baumgartner (1989) is revealed by the intraclass coefficient (ICC). For the C40, with the thirty-two subjects utilized in the present thesis, the ICC was 0.90 and still without statistically significant alteration from one "attempt" to the other when the two retained attempts are compared (paired t test), of the three performed by the basketball players, thus demonstrating the important fidedignity in this marker.
In addition to the fidedignity of the C40, another important question to be discussed refers to its validity, which precedes the analysis of the results. Pauole et al (2000) validated the T Test here denominated C40, through the predictive validity and also the concurrent validity, utilizing the tests of velocity, agility and explosive force with vertical jumps as criteria.
In relation to the dynamics of the C40 at different moments, the findings relative to the comparison between T0 - T1 (Table 3) permit us to securily affirm that, when loads of strength are concentrated in the preparatory phase (CXM and CLM), there was an important and positive alteration in the velocity of displacement. Average increments of 2.93% for the CXM and 4.23% for the CLM were observed for the C40, with a CI 95% which suggests real improvements in the CAV between approximately 0.90 and 5% for the Model whose subjects were submitted to concentrated strength load during the preparatory phase.
Differently from that observed for the individuals of the CLM and CXM, the content developed during the preparatory phase for the subjects belonging to the SLM seems to have a negative influence on CAV during the period in question. An average reduction of 2.81% and a confidence interval, reflecting a real drop of approximately 0.85 to 4.77%, reinforce this affirmation of a decline of the group with this marker.
These findings are in accordance with those verified by Moreira (2002), also in regard to the CAV utilizing the same control test, when he investigated the concentrated loads in basketball players of the same level as those utilized in the present study.
However, with respect to the SLM, the results were distinct from those presented by Moreira et al. (2005b) in an investigation with female basketball players, using a model similar to the one denominated in the present study of SLM; in this investigation, the authors encountered improvements in the CAV after 6 weeks of training.
It is possible that the different responses regarding the type or direction (positive or negative) between the study by Moreira et al.(2005b) and the results of this present study concerning the first six weeks of preparation can be explained by the gender of the sample or even by the level of the subjects' trainability. Doubtlessly, a greater number of investigations on the model based on the concepts of the selective-load system and its effects on basketball will be necessary for deeper considerations in this sense.
For the subjects' response in the CLM and CXM Models (T0 - T1), it is possible to admit that the results observed - improvement in performance after concentration of the strength loads - may be associated to a possible improvement in the strength level or even in the explosive strength relative to the "high" part of the force-time curve (Schmidtbleicher, 1992), or even at some "intermediary" point of this curve whose relation with the phase of initial acceleration seems to be elevated. For example, Baker and Nance (1999) reported significant correlations (P < 0.05) between the velocity for the distance of 10m and the power generated in jumps with a bar over the shoulders with different externals resistances and with movements similar to weight lifting. These correlations were verified for the scores relative to corporal mass. The greatest correlation was verified between the velocity for 10m and the relative power generated with external resistance of 100kg, the largest used in this study.
Young et al. (1995) reported a correlation of 0.86 (P < 0.01) between the maximum force developed (peak force) during a jump with a 19kg bar on the shoulders (only the concentric phase), with starting acceleration in elite male and female Junior-category athletes, members of the Australian track and field team; the authors concluded from their study that the capacities and manifestations of strength and the level of these manifestations differ in the contribution and association to the starting acceleration and to the maximum velocity of the race.
Sleivert and Taingahue (2004) observed that in the majority of collective sports, the sprints frequently occurred over short distances from both standing and rolling starts. This characteristic was also identified in the studies of McInnes et al. (1995) and Taylor (2003) for basketball.
In this way, Sleivert and Taingahue (2004) affirm that the acceleration phase and, predominately, the initial acceleration ("starting" acceleration) are the most important aspects for athletes and, additionally, through the results presented in this study, which investigated the relation between the performance of "starting" acceleration and variables of force and power, that the development of "peak force" has a more important role in "starting" acceleration than in maximum velocity.
Cronin and Hansen (2005, 20056) reinforce the necessity of this distinction between maximum velocity and acceleration and, therefore, assume that the maximum velocity cannot be reached, for example, in sports such as basketball, which essentially depends on the capacity to repeat short sprints innumerous times.
Cronin and Hansen (2005) verified that the height reached in a vertical jump with countermovement and without the utilization of the countermovement, as well as the power generated in the jump without the technique of the countermovement (jumps with a 30kg bar on the shoulders), can distinguish an athlete in relation to acceleration.
The authors studied professional rugby players and inferred that the findings could, in a certain way, be more useful for the other collective sports than when verified in others athletes, for example, track sprinters, for innumerous factors, among them the technique of differentiated running in relation to the center of gravity, knee flection in the phase of recuperation after running, among others. The authors also consider that the elevated performance at short distances (accelerations) is intimately associated with the capacity of generating a large quantity of force at a determined moment.
These previous considerations may, in part, explain the motives by which we have verified an increment in the capacity of performance of accelerations with change in direction, (cyclic-acyclic displacement velocity) after the concentrated strength loads in the study of basketball players.
It is possible that, despite the basketball players having reached the state of overreaching (Plisk & Stone, 2003), an expected phenomenon when strength loads are concentrated, the nature of the test (C40) does not permit the verification of this phenomenon and, to the contrary, what is observed is the increment of the work capacity, which perhaps is due to the increment of the level of dynamic maximum force or another manifestation of strength, important for the realization of acceleration and not measured in the preset study.
With regard to the magnitude of the effect of treatment between T1 and T2, the CLM presents a strong tendency towards the decline in CAV (Table 4). The average of real decline would be approximately between 1.15 and 4.90% (95% CI), values that are in accordance with the findings of Moreira (2002 and Moreira et al. (2004) which verify a decline of approximately 4% for the measurement of central tendency of adult, male basketball players submitted to the concentrated loads of velocity, exactly the content realized by the subjects of the CLM between T1-T2.
The considerable increase of exercises with high metabolic intensity (special phase of the CLM [CP 1 - APPENDIX B] - concentrated loads of velocity) seems to actually induce the reduction of the possibilities of the realization of the efforts related to the CAV. Differently, the Models, which at this instant were characterized by the more diluted organization of the training and competition loads (CXM and SLM) made the increment of the performance possible in this attribute.
We could speculate that the reduction of the level of maximum dynamic strength (or any other manifestation of strength not measured in the present study) would generate a negative impact on the capacity of performance of this marker, in addition to other factors that contributed to this alteration, which also were not the investigation target of the present study.
Perhaps this phenomenon can also be explained by the same considerations on the nature of the test and its close relationship with initial acceleration and, possibly, at a lesser degree, with maximum velocity.
The C40 consists of frequent stops and changes in direction, that is, abrupt stops with rapid reinitiation of movement, which, at this instant, present low velocity, a moment in which the relative dynamic maximum strength could be strongly associated with the initial acceleration. It also calls attention to the superior increment of the SLM subjects in relation to the CXM individuals due to the decline of the SLM subjects in T1. The statistically significant differences are verified at this moment only between SLM and CLM, revealing that distinct responses can be expected in function of the form in which the content is organized during the training macrocycle.
Table 5 presents the data regarding the magnitude of the effect during the competitive phase (T2-T3). The SLM subjects presented a more significant magnitude of effect. Important differences are verified between T2-T3 for the SLM. However, it can be noted that the increment is also demonstrated for the other two Models.
Analyzing the results related to the magnitude of the effect between T2-T3 and also for the beginning of the macrocycle (T0) and the end of the competitive phase (T3), important improvements are manifested in the three Models investigated.
We can verify that, despite the differences of magnitude of effect, the basketball players still experienced improvements in this attribute during the competition phase (T2-T3) that, without a doubt, reveal the efficiency and effectiveness of the Models for this marker, independent of the strategy utilized.
The same can be inferred with regard to the findings relative to the comparison between T0 -T3. An interpretation of these data suggests that, for this marker, improvements could be expected, based on a well-organized structuration, independent of the Model. The SLM and CXM presented values a bit more expressive concerning the magnitude of the effect than that of the CLM in relation to the mean and confidence intervals for the mean between T0 -T3, which may be due to the negative alteration [reduction of CAV with an increment of the time to cover the distance (12%)] of only one athlete in this Model, which surely affected the group's average considerably and that is probably due to factors other than those of the treatment (Model).
This impact of a possible outlier probably contributed in a substantial manner for the alteration between T0 -T3 for the CLM not to be considered statistically significant, differently from what was encountered for the SLM and CXM for which the modifications in performance or, yet, the evolution in the performance for this marker was identified as statistically significant.
It can be admitted that the three Models investigated in this study induced the important alterations of these markers, the performance of which is intimately associated to the nature and demand of the basketball game, with respect to the repeated accelerations, with short distances and rapid changes in direction, starting innumerous times from a "stopped" position to the fastest velocity possible (starting acceleration) and, then, disaccelerating abruptly and performing another action.
However, special attention should be given to the alteration dynamics of this marker during the macrocycle since behavior is different for the distinct Models. This phenomenon is fundamental regarding the organization of the content of training, as well as its investigation, however, studies on this approach are rare. In the practical ambit, the trainer must abide by these particularities in order to opt for a strategy (Model) of structuration and the researcher, when investigating aspects related to the performance, must take into consideration that it may vary according to the dependence of the moment and content of training.
It is important to emphasize that the characteristic of the design of the present study, with important external validity and considerable originality, presents limitations that should be noticed; for example, it was not possible to control the temperature and, for this reason, it is possible that we have different results due to the variation of the temperature for each moment of control. Variables such as food, sleep and/or rest were not controlled. However, during the entire study, the subjects were advised of the importance and impact of these variables on their performance.
The motivational factor is always another threat to the fidedignity of the results, being as it is, a phenomenon affected by different variables (family, health, victory, defeat, group environment, salaries, etc.). For this reason, all efforts were made to minimize possible alterations due to motivation for the realization of the training program, as well as in the moments of data collection, through processes of conscientization (talks, reunions, etc.) and even self-stimulation during the training and control sessions. The size of the sample in each Model, despite its relevance in the context of sports training, also represents a limitation, especially regarding the findings of the present study, suggesting a greater number of studies of different teams, based on the utilization of the concepts of the models utilized here, in order to observe the results in a more ample and diversified spectrum.
ConclusionThe concentrated strength loads developed in the PP (CLM and CXM) made increments of the performance of C40 possible. The CXM revealed the greatest increments when compared with the T0-T3 moments. However, it is reasonable not to assume a Model as the most efficient but, instead, that the differences that concern the organization of the content (exercise and methods) cause distinct effects during the training process, a phenomenon demonstrated by the present study, revealing that the behavior (dynamic) of the C40 is model-dependent. It is important to admit that independently from the adopted strategy, a rational structuration of the training content can lead to the results programmed for the C40 and that the selection of an appropriate Model should be determined based on knowledge of the dynamics of the responses of adaptation to the distribution of loads and in accordance with the competitive calendar.
Practical implications
Clear knowledge of the different effects in respect the sequence and distribution of load during the macrocycle is necessary for the trainer.
Tracking the dynamics of measures (markers) due easy, inexpensive, validly and accessible test is a good solution for the study of basketball players´ behavior during the macrocycle.
The use of magnitude of effects to analyze longitudinal researches seems to be interesting and more informative when investigated the high level athletes instead use only the hypotheses test.
AppendixAppendix A
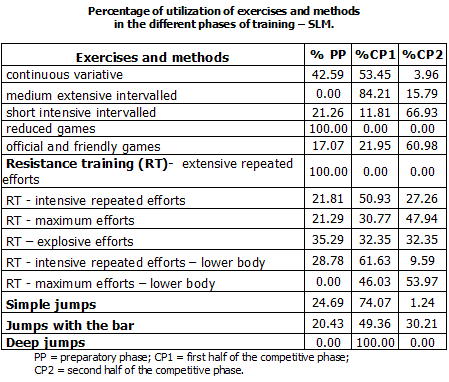
Appendix B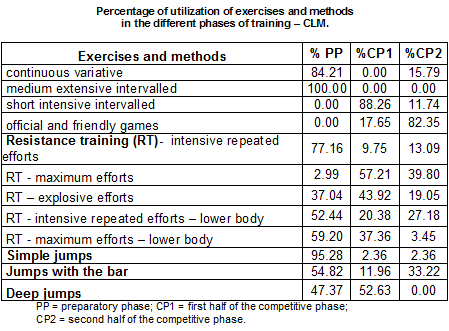
Appendix C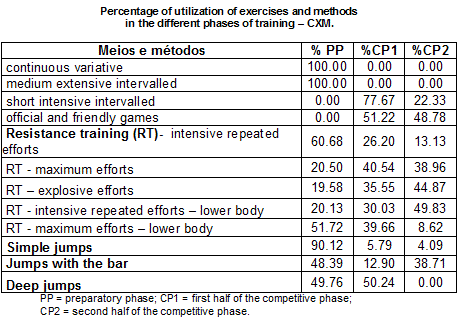
References
Baker, D. & Nance, S. (1999). The relation between running speed and measures of strength and power in professional rugby league players. J Strength Cond Res, 13, 230-235.
Baumgartner, T.A. (1989). Norm-referenced measurement: reliability. In: Safrit, M.J. & Wood,T.M. (Eds.), Measurement concepts in physical education and exercise science (pp. 45-72). Champaign, IL: Human Kinetics.
Cronin, J.B. & Hansen, K.T. (2006). Resisted sprint training for the acceleration phase of sprinting. Strength and Cond J, 28, 42-51.
Cronin, J.B., Mcnair, P.J. & Marshall, R.N. (2001). Relationship between strength qualities and motor skills associated with court performance. J Hum Mov Studies, 40, 207-224.
Cronin, J.B. & Hansen, K.T. (2005). Strength and power predictors of sports speed. J Strength Cond Res, 19, 349-357.
Gomes, A.C. (2002). Treinamento desportivo - estruturação e periodização. Porto Alegre: Artmed.
McInnes, S.E., Carlson, J.S., Jones, C.J. & McKenna, M.J. (1995) The physiological load imposed on basketball players during competition. J Sports Sci, 13, 387-397.
Miller, M.G., Herniman, J.J., Ricard, M.D., Cheatham, C.C. &, Michael, T.J. (2006). The effects of a 6-week plyometric training program on agility. J Sports Sci Med, 5, 459-465.
Moreira, A. (2002) Basquetebol: sistema de treinamento em bloco - organização e controle. [Máster thesis. Faculdade de Educação Física]. Campinas (SP): Universidade Estadual de Campinas].
Moreira, A., Oliveira, P.R., Okano, A.H., De Souza, M. & Arruda, M. (2004). A dinâmica de alteração das medidas de força e o efeito posterior duradouro de treinamento em basquetebolistas submetidos ao sistema de treinamento em bloco. Rev Bras Med Esporte, 10, 243-250.
Moreira, A., Okano, A.H., Ronque, E.R.V., Vecchi, L. & Oliveira, P.R. (2005a). Reprodutibilidade dos saltos vertical e triplo horizontal consecutivo e da corrida com mudança de direção em basquetebolistas de alto rendimento. Sports Science Congress. Campinas, Brasil: UNICAMP.
Moreira, A., Okano, A.H., De Souza, M., Oliveira, P.R. & Gomes, A.C. (2005). Sistema de cargas seletivas no basquetebol durante um mesociclo de preparação: implicações sobre a velocidade e as diferentes manifestações de força. Rev Bras de Ciência e Movimento, 13, 7-16.
Pauole, K., Madole, K., Garhammer, J., Lacourse, M. & Rozenek, R. (2000). Reliability and validity of the T-Test as a measure of agility, leg power, and leg speed in college-aged men and women. J Strength Cond Res, 14, 443-450.
Plisk, S.S. & Stone M,H. Periodization strategies (2003). Strength and Cond J. 2003, 25, 19-37.
Schmidtbleicher, D. (1989) Training for power events. In: Komi, P.V. (Ed.), Strength and power in sports (pp. 381-395). Oxforfd: Blackwell.
Semenick, D. (1990). Tests and measurements - The T-test. NSCA Journal, 12, 36-37.
Sleivert,G. & Taingahue, M. (2004). The relationship between maximal jump-squat power and sprint acceleration in athletes. Eur J Appl Phys, 91, 46-52.
Taylor, J. (2003). Basketball: applying time motion data to conditioning. Strength and Cond J, 25, 57-64.
Tsitskaris, G., Theoharopoulos, A. & Garefis, A. (2003). Speed, speed dribble and agility of male basketball players playing in different positions. J Hum Mov Studies, 45, 21-30.
Young, W., McLean, B. & Ardagna, J. (1995). Relationship between strength qualities and sprinting performance. J Sports Med Phys Fitness, 35,13-19.
 |
|
|---|---|
|
revista
digital · Año 12
· N° 117 | Buenos Aires,
Febrero 2008 |
|